
What happen with this graph?
The name that you can give to the chart to describe what represents.
It's useful to visualize size comparisons. These can be relative (simply being able to see bigger/larger) and show variables that can be counted
What are the gridlines?
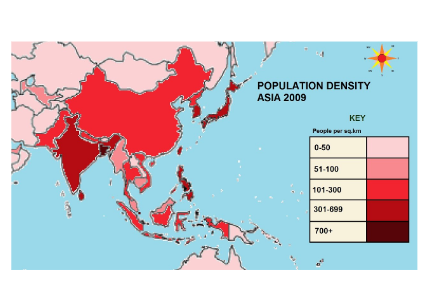
This type of graph corresponds to?
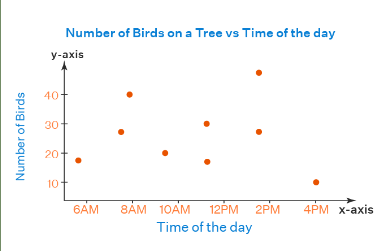
Graphs of correlation
Axes
It's an example of derivation graphs.

What is the name?
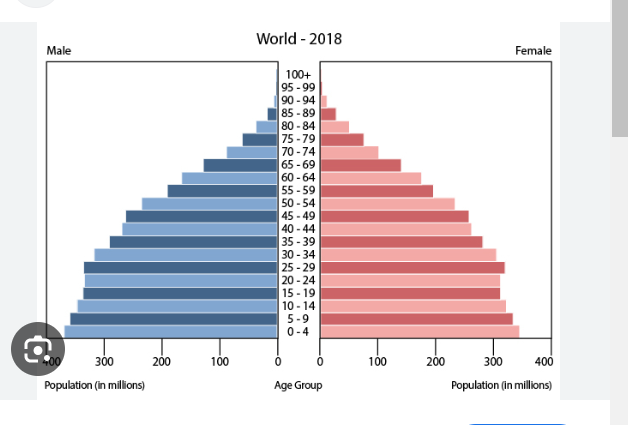
Population pyramid
Spatial graph
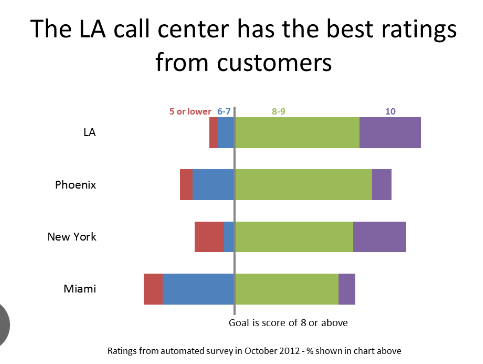
Diverging bar
Known for showing the distribution of the population by sex. In fact, it is a combination of two horizontal bar charts sharing the vertical axis
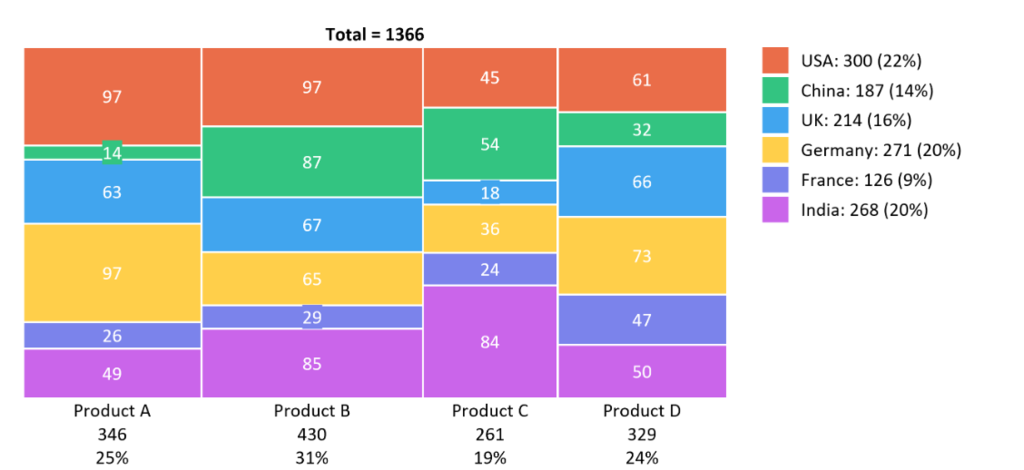
Chart title
Graphs of magnitude
Pie Chart

The guide lines set in the background to see better the data

Lines on which the chart is created from the data
Useful to show the relationship between two or more variables
It's misleading